

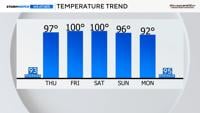
How hot it is or cold, has a lot to do with perspective. What is normal or typical for one area might not be for another. Our bodies get used to temperatures, but when records are broken it’s at least somewhat rare. The National Weather Service keeps track of daily and monthly averages.
A thirty year average is the same thing as normal. Current readings are compared to 1991-2020 normal values for indices like the Heat Risk Map or extended forecasts from the Climate Prediction Center. Averages can be used to analyze precipitation, temperature, and a wide variety of other weather observations. Data can tell us how many triple digit days we typically see in a year, as well as how much rain or snow is typical in one year or per month.
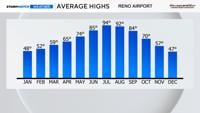
July is usually Reno’s hottest month, with an average high of 94 degrees. December is usually the coldest with an average high of 47. January is very similar with an average high of 48 degrees. The daily average high changes throughout the month as well. The average daily high for Reno is 93 degrees on July 8th, but for the entire month it is 94.

The average temperature does not mean that we usually see a certain temperature every day. Similar to a class grade, it takes into consideration high temperatures throughout the month and then divides the total by the number of values. For example, if you get a 95% as a final grade in a class, you probably got there through a variety of scores on tests and assignments, and not the same 95% each time.