
Records continue to fall as warm air sits over the west coast this month, but the extended forecast is beginning to show a change in the weather pattern for Northern Nevada for the end of March.
It’s easy to get excited about a long-term forecast, especially if you have big plans, but in all honestly forecast accuracy goes down with time, especially after five days.
Three days is optimum. Plan on long range forecasts going up and down, sometimes showing a storm during one run and sunny skies the next. Long range forecasting is best utilized for trend recognition.

The next couple of weeks are looking different than the last two.
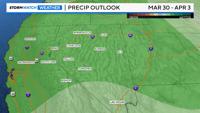
The extended forecast is trending wetter than average from March 30th through April 7th as this stubborn area of high pressure moves east.
This also means a cool down, how much cooler is still to be determined.
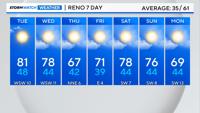
Average for this time of year is roughly 61 degrees. Extended forecasts are made by looking at a variety of deterministic models, ensembles, teleconnections, and analysis.
Most weather apps only show one model's perspective, similar to putting all your eggs in one basket. Sure, they can be right sometimes, but more often than not they are not showing the entire story.

See the latest forecast by clicking here.
Models are initialized by observations, and not every observation point is completely accurate, nor are there observation sites everywhere in the world.
This means, that computer models have to parameterize the data through thousands upon thousands of math calculations. If the observations are slightly off, then model output will be too. Similar to a game of telephone.
The higher the resolution, the better the forecast should be. Without as many data points in the ocean, forecasting out west can be more challenging than the central part of the country.
Microclimates also require higher resolutions. This also makes detailed thunderstorm forecasting for a pinpoint location challenging as well.

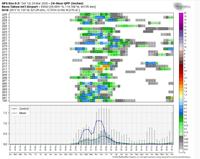
Notice most ensemble members are showing some precipitation falling in Reno early next week. The amount is still to be determined. For example, a teacher gets a better feel for a student’s knowledge after completing multiple tests, rather than after just one. This is just one update, if the models show something similar the next few days, confidence gets even higher.
Ensembles are one way to look behind the door of the models and get an idea of what’s going on.
A deterministic model is the main output from, say, the GFS or Euro model. Ensembles are many different model runs from many different models, showing a variety of scenarios.
Ensembles have a lower resolution but tell a very important part of the weather story. The GFS model, for example, has at least 30 different ensemble members that updates four times a day. The Euro has slightly more.

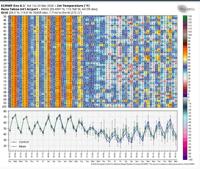
This shows many members of the Euro forecasting cooler temperatures next week. Trends are better than exact forecasts long term.
Ensembles give meteorologists an idea of ranges for precipitation totals or max temperatures. For example, ensembles could let us know snow totals will likely be around five inches, but at the most eight, and at the least three (not a forecast, only an example).
If many ensembles are showing the same thing, then that could be a clue of what the outcome will be.
Models are only a guide, it is the meteorologist’s job to analyze the data to see what the most likely outcome is, through pattern recognition and analysis.
Teleconnections are one way meteorologists can do this, more to come on that in a separate post.
